Annual Distance And Wear
Odometer mileage is a proxy for wear, yet the same 60,000 miles can reflect very different driving patterns. Annual distance matters because many wear processes track time and distance together: engine oil degradation, brake pad wear, tire aging, and corrosion risk. A car driven 12,000 miles per year for five years often faces different stress than a car driven 6,000 miles per year for ten years, even when totals match. Short trips also change the story by keeping engines in warm-up mode longer and increasing condensation in the crankcase. The practical goal is to translate mileage into likely maintenance intervals and remaining life, using evidence from records and inspection rather than a single number.
What Buyers Commonly Misread
Many listings treat mileage as the only variable, then ignore how driving pattern changes wear. Brake wear depends on stop frequency and vehicle weight, not just total miles. Tire wear depends on alignment, inflation habits, and road surface, and tire age can matter even with low mileage. Corrosion depends on climate exposure, road salt frequency, and whether the car spent winters outdoors. Service history also changes the outcome: an oil change every 5,000 miles with the correct oil spec produces a different engine than an oil change done late or with the wrong viscosity. Even the odometer reading can be misleading if the car has had instrument cluster replacements or odometer tampering, which is why documentation and VIN-based checks matter.
Supporting technologies and dependencies shape what you can verify. The odometer reading comes from the instrument cluster and may be altered during repairs, while the vehicle’s diagnostic history depends on how often the car was serviced and whether scan tools recorded codes. Many cars store fault codes and readiness monitors, but the availability of those records varies by service shop and region. Tire age can be read from the DOT date code, yet buyers often skip it because it requires close inspection. Brake rotor condition can hint at pad life, but rotor resurfacing history complicates interpretation. A careful buyer treats each data point as a clue, then weighs it against the rest of the evidence.
Solutions And Advice
Convert Miles Into Usage
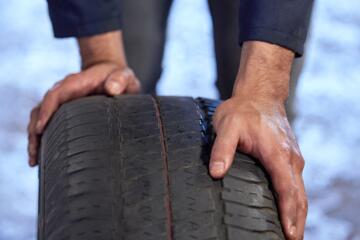
Start with annual distance: divide total odometer miles by the car’s age in years, using the first in-service date if you can find it on the vehicle history report. If a car shows 45,000 miles at 3 years old, that implies about 15,000 miles per year, which usually aligns with more frequent brake and tire wear than a 7,000-mile-per-year commuter. Then separate “distance wear” from “time wear.” Tires age from UV and heat cycles, so a 4-year-old set can look worn even at low mileage, and a 9-year-old set can fail inspection even if tread depth seems acceptable. I often see buyers focus on tread depth alone; the DOT date code on the sidewall tells a more honest story.
Use a simple expectation range for planning inspections. For example, many brake pads last longer in steady highway driving than in dense city traffic, and a car with high annual miles in stop-and-go conditions can show earlier brake service. Oil change intervals also vary by manufacturer and driving conditions; if the service record shows late oil changes, engine wear risk rises even when annual miles look moderate. When records are missing, assume the worst-case maintenance timing and negotiate accordingly.
Verify Records With VIN Data
Request the VIN and compare the odometer reading across documents: listing photos, service invoices, and any inspection reports. If the seller provides service records, check that dates and mileage increments match a plausible driving pattern. A gap of several years with no recorded service can still be normal for a low-mileage car, but it becomes suspicious when the car also shows heavy wear signs. For odometer rollback concerns, VIN-based history services can flag inconsistencies, though results depend on what data sources reported to the provider. In my experience, the most useful detail is the earliest recorded mileage and the most recent recorded mileage, because they anchor the timeline even when individual entries are sparse.
Bring a scan tool only if you know what you’re looking for. A generic OBD-II reader can pull stored codes, but it cannot confirm whether codes were cleared right before sale. Some cars also support live data that helps detect issues like misfires or fuel trims, yet interpreting those signals requires context. If you cannot interpret scan data, a pre-purchase inspection by a qualified mechanic remains the most reliable way to translate codes into repair likelihood.
Inspect Wear Items By Age
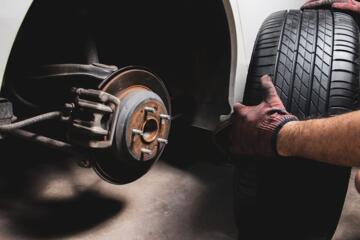
Use a structured inspection that separates wear from neglect. Tires: record tread depth and check the DOT date code; a set with a recent date but uneven wear can still indicate alignment problems. Brakes: inspect pad thickness, rotor surface condition, and whether the calipers show corrosion or uneven contact. Suspension: look for torn boots, leaking shocks, and play in ball joints; these can show up even at moderate mileage if the car lived on rough roads. Fluids: verify coolant condition and brake fluid condition when possible, since time-based degradation affects corrosion and braking performance. If the car has a history of winter driving, inspect underbody surfaces and the condition of brake lines for rust.
For a quick “time wear” check, look for rubber components that age faster than they wear: engine mounts, belts, hoses, and the condition of wiper blades. A car with low annual miles can still have aged rubber if it sat through heat cycles. I once reviewed a 2016 model with 28,000 miles where the tires were “new-ish” but the wiper linkage boots were cracked; the mileage didn’t explain the condition, the climate did.
Negotiate Using Evidence, Not Fear
Turn findings into a repair plan rather than a vague discount request. If tires show uneven wear and the DOT code indicates older rubber, budget for replacement and alignment. If brake rotors show heavy scoring and pads are near minimum thickness, request a price adjustment based on parts and labor estimates from local shops. If service records show oil changes late by thousands of miles, treat engine risk as higher and ask for a fresh oil service before purchase. A realistic outcome depends on the vehicle and region, but you can often translate inspection findings into a negotiation range by using at least two local quotes for the same work.
When the seller resists documentation, treat that as a data point. A refusal to share maintenance history does not prove fraud, yet it increases uncertainty, and uncertainty should affect price. If you plan to buy anyway, schedule a post-purchase inspection within the first week so you can act on issues discovered after handoff.
Case Examples
City-Driven Sedan With High Annual Miles
A buyer considers a 2018 sedan with 78,000 miles and a reported first in-service date in late 2017, implying roughly 13,000–14,000 miles per year. The service history shows oil changes every 6,000–7,000 miles, but brake service appears only once at around 55,000 miles. During inspection, the front pads measure low and rotors show uneven wear, matching the stop-and-go pattern. The buyer budgets for brake work and checks tire DOT dates, finding the tires are 3 years old with mild cupping. The decision centers on consistent oil records and the likelihood of near-term brake and tire replacement, not on the odometer alone.
Low-Mileage Car With Time-Based Aging
A buyer evaluates a 2015 crossover with 42,000 miles, which implies about 7,000 miles per year. Service records show infrequent visits, and the tires have a DOT date code from early 2016, meaning the tires are about 8–9 years old. The inspection finds cracked wiper blades, aged rubber on hoses, and surface rust on brake components consistent with winter exposure. The engine bay looks clean, but the brake fluid appears dark, suggesting time-based degradation. The buyer negotiates for tire replacement and brake fluid service, then plans a full fluid refresh after purchase. The mileage looked “light,” yet time wear drove the risk.
Mileage Vs Wear Checklist
| Item | What Annual Miles Suggest | What Time Adds | Evidence To Check |
|---|---|---|---|
| Engine | Higher miles increase oil-change frequency needs | Condensation and oil aging from short trips | Service invoices, oil viscosity spec, inspection for sludge |
| Brakes | City driving accelerates pad wear | Rust on rotors and calipers after sitting | Pad thickness, rotor scoring, caliper corrosion |
| Tires | Higher miles increase tread wear | Aging affects grip even with tread left | DOT date code, uneven wear pattern, sidewall cracks |
| Corrosion | More miles can mean more exposure time | Salt and time drive underbody rust | Underbody inspection, brake line condition, frame surface rust |
Step-by-step decision checklist: 1) Compute annual miles using first in-service date. 2) Check tire DOT date code and match it to the car’s age. 3) Compare service record mileage increments to a plausible driving pattern. 4) Inspect brakes and suspension for uneven wear that suggests driving style or neglect. 5) Use a pre-purchase inspection to translate findings into a repair budget, then negotiate based on documented needs.
Common Mistakes
Buyers often treat low mileage as a guarantee of low risk, then miss time-based aging. Tires with old DOT codes can fail inspection even with remaining tread, and rubber components can crack after years of heat cycles. Another mistake is ignoring driving pattern: a car with moderate annual miles but frequent short trips can accumulate condensation in the engine oil, which affects wear and sludge risk. Some buyers also over-trust listing photos; a photo can hide uneven tire wear or a worn brake rotor edge. A third mistake involves assuming service records prove condition; invoices show that work happened, but they do not confirm oil spec, correct parts, or whether the work was performed on schedule.
Odometer concerns also get mishandled. Instrument cluster replacements can change odometer readings in ways that look like rollbacks, and some cars have multiple odometer-related counters. VIN-based history tools can help, but they depend on data availability and reporting. If a seller provides no VIN history and refuses a pre-purchase inspection, the uncertainty stays high, and the buyer pays for that uncertainty later. I find it helpful to write down every discrepancy between listing claims and records, because small mismatches often reveal larger gaps.
FAQ
How Do I Calculate Annual Miles?
Use the first in-service date from the vehicle history report or registration records, then divide the current odometer reading by the number of years since that date. Round to the nearest 500 miles per year for planning, then compare with service intervals.
Is Low Mileage Always Better?
Low mileage reduces distance wear, but it does not prevent time wear like tire aging, rubber cracking, and corrosion from road salt exposure. A low-mileage car with old tires and dark brake fluid can still need near-term repairs.
What Signs Show Brake Wear From City Driving?
Look for thin pads, uneven rotor scoring, and caliper corrosion, especially on the front axle. Brake dust patterns and steering feel can also hint at uneven contact, though a mechanic’s measurement gives the most reliable picture.
How Can I Spot Odometer Rollback?
Compare odometer readings across service invoices, inspection reports, and the earliest and latest VIN-based history entries. Rollbacks can be hard to prove from a single source, so inconsistencies across multiple documents carry more weight.
Should I Buy Based On Mileage Alone?
No. Annual miles help estimate wear rates, but service history, tire DOT dates, corrosion evidence, and inspection results determine the actual risk. Mileage alone cannot confirm oil spec, maintenance timing, or repair quality.
Author's Insight
Annual distance connects to wear because many maintenance intervals and component lifespans depend on both time and miles. Evidence-based buying uses multiple signals: service records for maintenance timing, DOT date codes for tire age, and inspection findings for corrosion and uneven wear. Odometer readings act as a starting point, not a verdict, because driving pattern changes how quickly brakes, tires, and engines accumulate damage. When records conflict, the buyer should treat uncertainty as a cost and adjust the offer or schedule repairs immediately after purchase.
Key Takeaways
- Annual miles estimate distance wear, but time wear drives tires, rubber, and corrosion.
- Service records and VIN-based mileage timelines reduce uncertainty more than odometer numbers alone.
- Inspect DOT tire dates, brake condition, and underbody rust to separate low mileage from low risk.
- Negotiate using inspection findings and repair quotes, not vague concerns.